
Mind Mapping
John Moran
1
and Amanda McCarty
2
June 2014
Description:
A mind map is a graphical diagram used to link, group, and organize ideas, thoughts, concepts,
actions, and information into a connected pattern around a single issue. A mind map is created
around a single issue, drawn as an image and described by a keyword in the center of a blank
piece of flip chart paper. As the improvement team develops the mind map through
brainstorming and other creative techniques, connections develop which demonstrates how
different ideas are connected directly to the central concept and how other related ideas branch
out from those. The mind map diagram is similar to a Tree Diagram
3
which is made up of ideas
or concepts that are connected by lines. The person interpreting the Tree Diagram must
understand the ideas that are written and then develop a mental image of all the connections. The
mind map is the mental image that shows the connections in one step.
Mind maps can be created by hand on a blank sheet of flip chart paper or by using many of the
software packages that are available. Other names for Mind Maps include Spider Diagram, Idea
Sun Bursting, Bubble Mapping
4
or Tree Diagrams.
When to Use:
A Mind Map is a creative tool that can help an improvement team to design solutions to existing
problems, create a new process, create a new service, or explore and develop objectives for a
strategic goal. This tool helps an improvement team to think outside the box in a non-linear
fashion and determine how things are connected to the issue at hand. It's also a very intuitive
way to organize your thoughts, since mind maps mimic the way our brains think—bouncing
ideas off of each other, rather than thinking linearly.
The Mind map helps an improvement team to generate ideas very quickly and it encourages
them to explore different creative pathways. Another technique to help get the creative juices
1
John W. Moran, Ph.D. is a Senior Quality Advisor to the Public Health Foundation and a Senior Fellow at the University of
Minnesota, School of Public Health in the Division of Health Policy and Management. He is a member of PHAB’s Evaluation
and Quality Improvement Committee, and Adjunct Professor in the Arizona State University College of Health Solutions' School
for the Science of Health.
2
Amanda McCarty, MS, MS-HCA, MBA is a Performance Management & Quality Improvement Consultant to the Public
Health Foundation and the Director of the Center for Performance Management & Systems Development at the West Virginia
Bureau for Public Health.
3
Public Health Quality Improvement Encyclopedia, Public Health Foundation, 2012, pp.145-146
4
http://en.wikipedia.org/wiki/Thinking_Maps
flowing in the improvement team is the SCAMPER Technique
5
which can be used in
conjunction with the Mind Map tool.
Construction Steps:
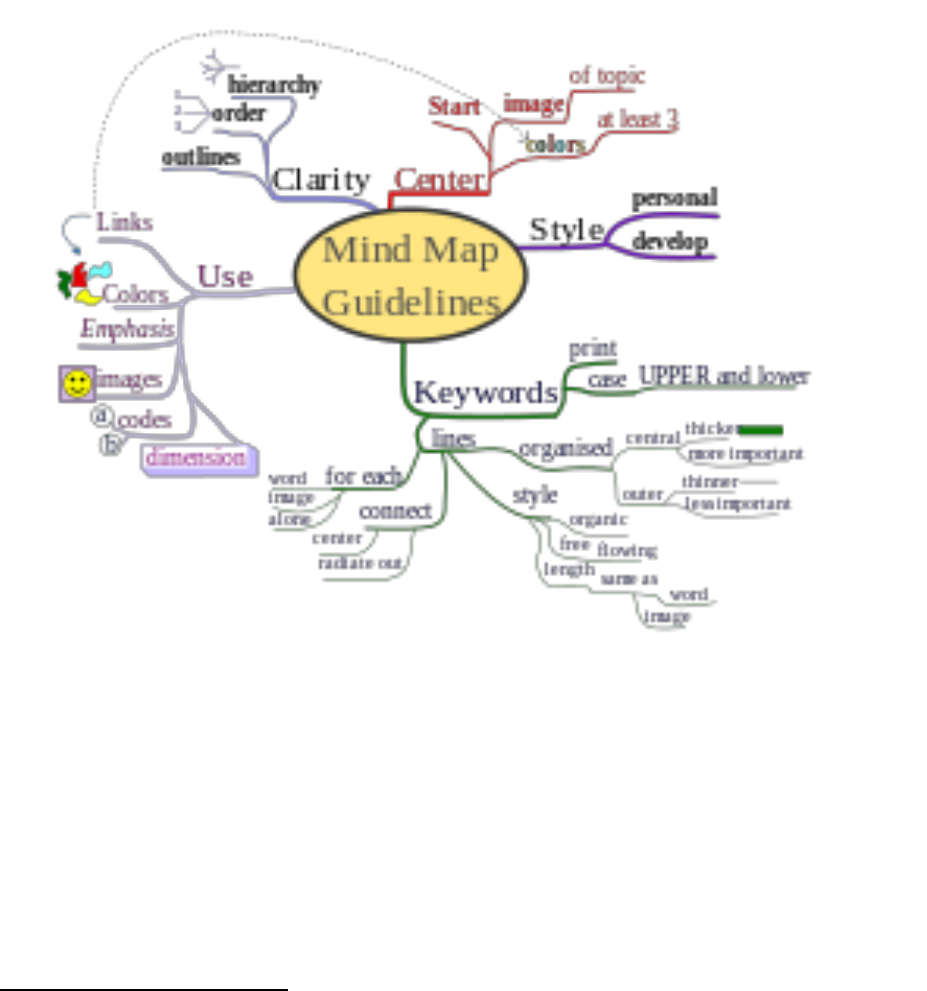
Figure 1
6
shows a way to construct a mind map. This illustration demonstrates how easy it is to
decipher a mind map since everything is connected to the central theme or concept.
Figure 1
1. In Figure 1, the Mind Map starts in the center with a main concept that the map will
revolve around. The main concept should be described by a key word and an image.
Having a large area to draw the map gives the improvement team room to be creative,
free flowing, and spread out collective ideas.
2. Images or pictures are used to enhance the central idea and sub-ideas: A picture is worth
a 1,000 words.
3. Colors are used throughout the Mind map to stimulate the brain and it makes the Map
look vibrant, which helps stimulate creativity of others on the improvement team.
5
http://www.phf.org/resourcestools/Pages/SCAMPER_Technique_Tool.aspx
6
http://en.wikipedia.org/wiki/Mind_map
4. Main branches are linked to the central image and then connect the lower level branches.
These linkages help round out the Mind Map. These sub-branches will also contain words
that elaborate on the topic of the branch it stems from. This helps develop and elaborate
on the overall theme of the mind map.
5. Keywords are used on the branches to explain the concept it represents and to help the
reader understand the logic of the flow and connections.
6. Curved lines are used in a Mind Map rather than straight lines as in a tree diagram. The
curved lines show that the Map is free flowing, not rigid like a Tree Diagram, and allows
for connections to be drawn that may impact multiple areas.
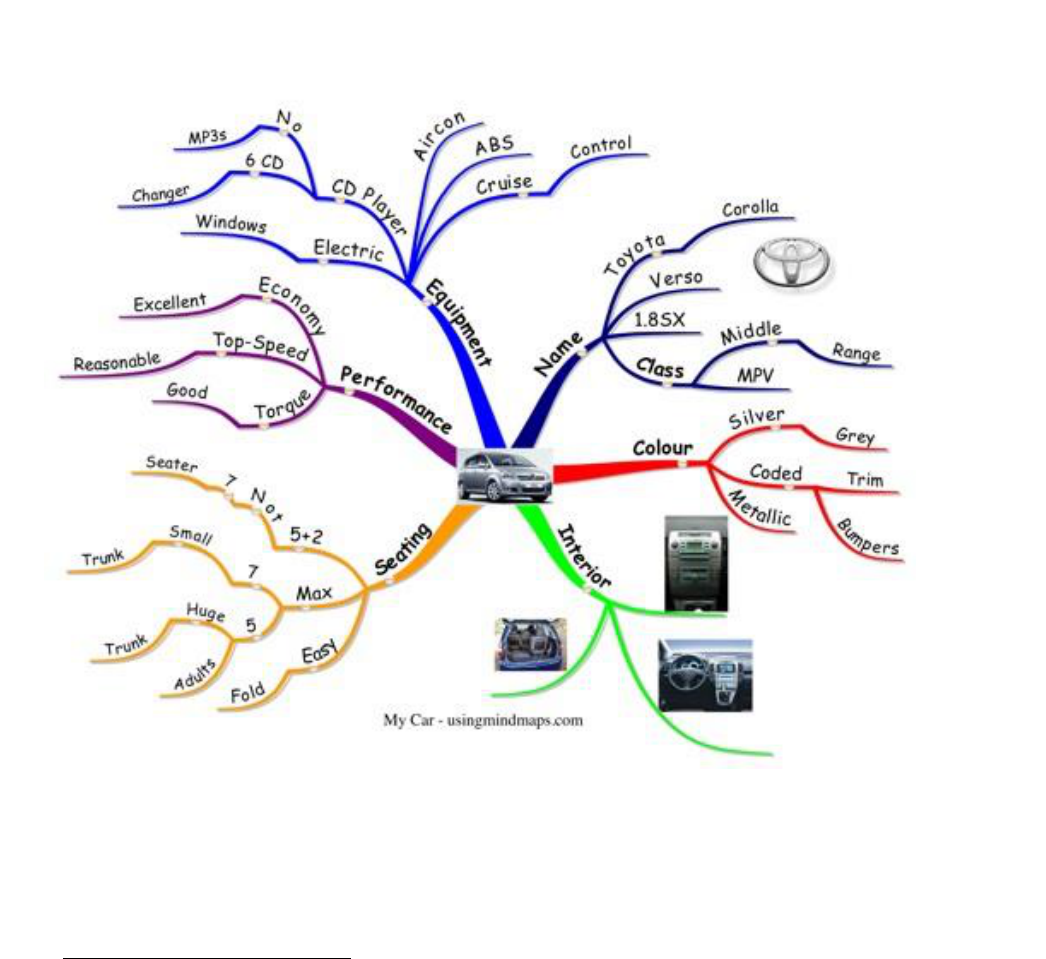
Mind Map Example:
7
7
http://www.usingmindmaps.com/mind-map-by-example.html
