
Statistical Briefing
2021-22

TDS Northern Ireland
is a wholly owned
subsidiary of
The Dispute Service,
providing both custodial
and insured tenancy
deposit protection.
The Tenancy Deposit
Scheme is operated
by The Dispute Service
providing tenancy deposit
protection in England
and Wales. TDS offers
both Insured deposit
protection, TDS Insured,
and Custodial deposit
protection, TDS Custodial.
SafeDeposits Scotland
is a custodial tenancy
deposit protection
scheme. It is a separate
company where The
Dispute Service is the key
partner and provides the
scheme’s key operational
services.
www.tdsnorthernireland.com
0300 037 3700
www.safedepositsscotland.com
03333 213 136
www.tenancydepositscheme.com
0300 037 1000
| TDS England & Wales
2
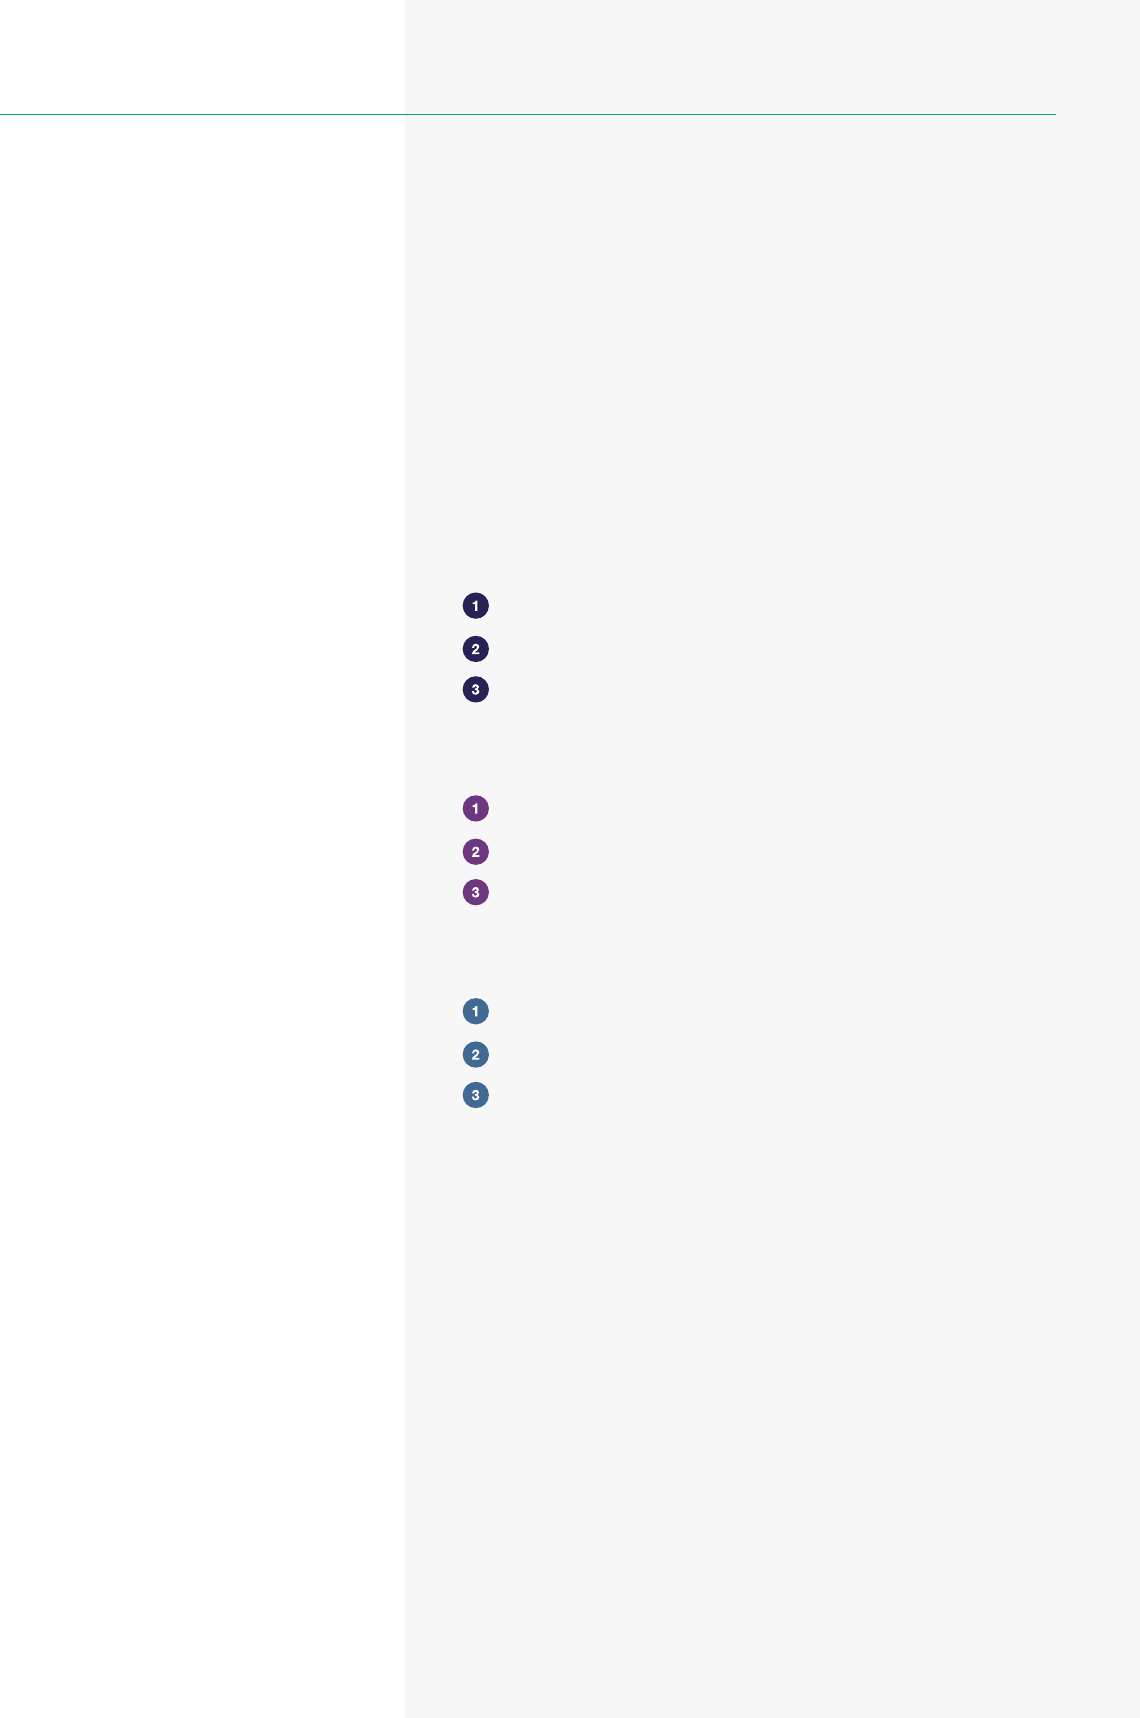
CONTENTS
Tenure in England & Wales 4
Tenancy Deposits in England & Wales 6
Disputes 8
TDS Northern Ireland 10
Tenure in Northern Ireland 11
Tenancy Deposits in Northern Ireland 13
Disputes 15
SafeDeposits Scotland 18
Tenure in Scotland 19
Tenancy Deposits in Scotland 21
Disputes 22
a
EXECUTIVE SUMMARY
This Statistical Brieng provides data on the work of the
tenancy deposit schemes across the UK; in England &
Wales, Scotland and Northern Ireland.
In each jurisdiction there are three government
authorised schemes which operate the statutory tenancy
deposit protection and dispute resolution services.
THE DISPUTE SERVICE
The Dispute Service is a Government approved,
not-for-prot company that provides Insured and
Custodial tenancy deposit protection (TDP) in the
private rented sector.
The tenancy deposit protection legislation was
introduced in April 2007 in England and Wales as a
result of the 2004 Housing Act. Similar provisions came
into force in Scotland in July 2012 and in Northern
Ireland in April 2013.
The Dispute Service provides TDP services through
the Tenancy Deposit Scheme in England & Wales,
SafeDeposits in Scotland and TDS Northern Ireland.
*Some of the data included is Government data released
under the Freedom of Information Act. Other data is The
Dispute Service’s own internal performance reporting.
| TDS England & Wales
3
TDS England & Wales
| TDS England & Wales
4
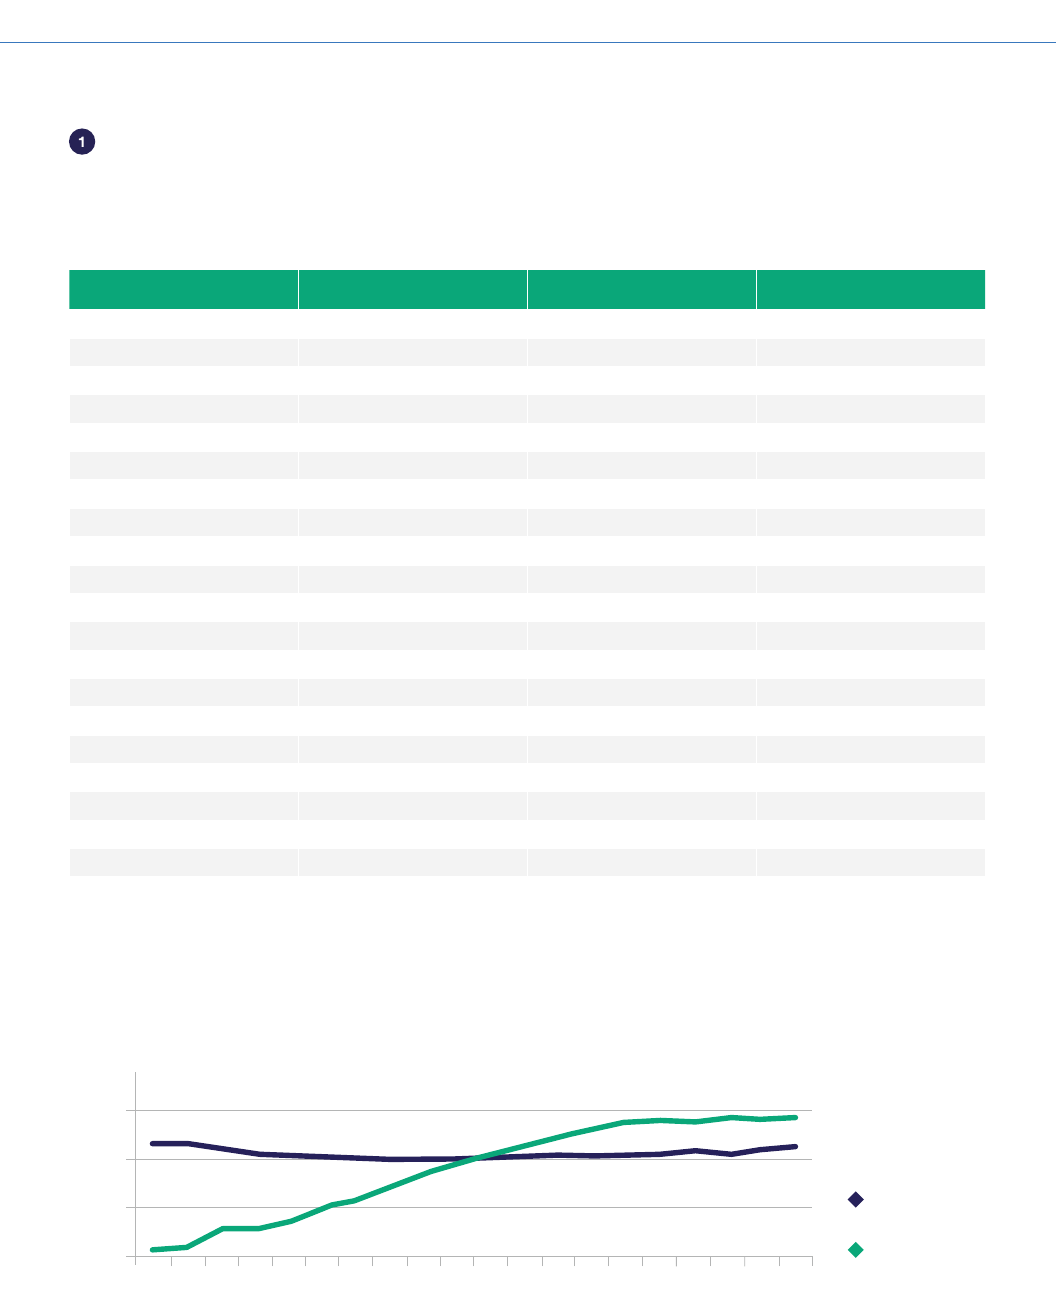
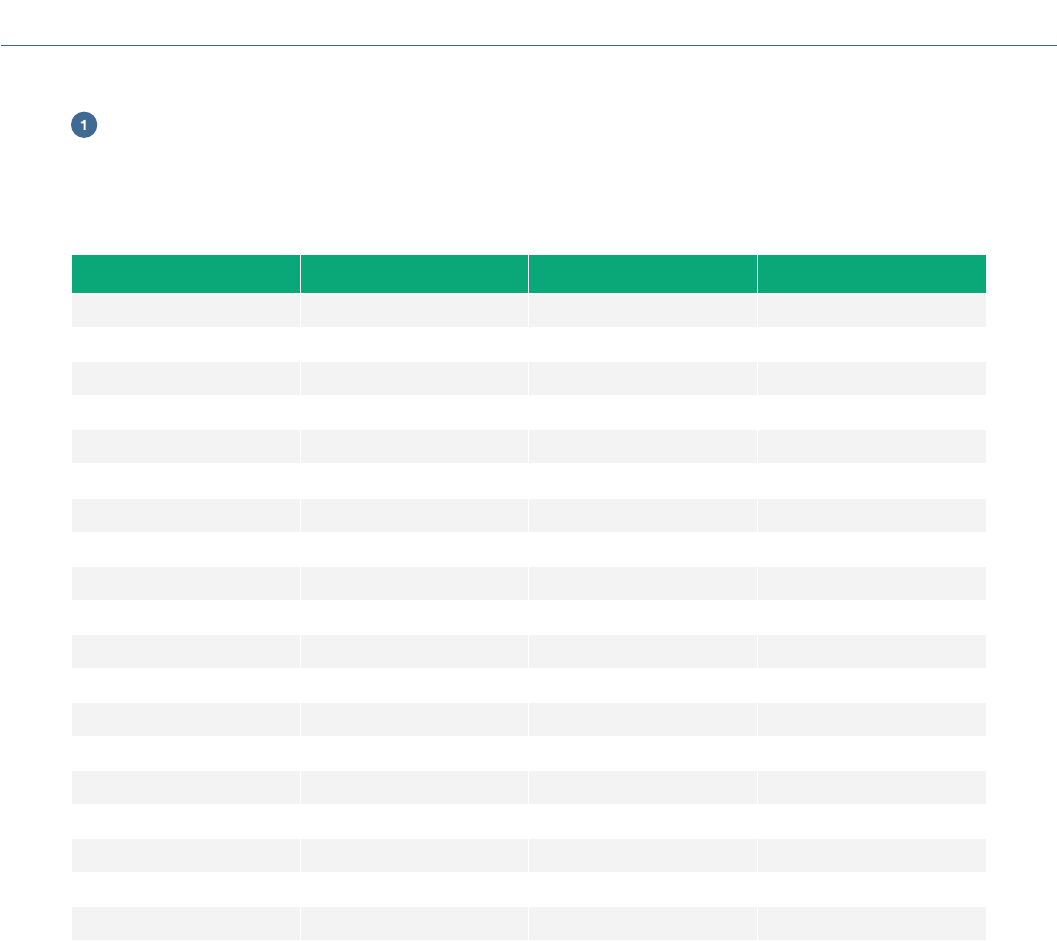
TENURE IN ENGLAND AND WALES
Source: Housing Review JRF/CIH
Year Owner occupation Social renting Private renting
2001 14.735 4.339 2.133
2002 14.846 4.310 2.197
2003 14.752 4.212 2.549
2004 14.986 4.120 2.578
2005 15.100 4.050 2.720
2006 15.052 4.034 2.987
2007 15.093 4.013 3.182
2008 15.067 4.000 3.443
2009 14.968 4.022 3.705
2010 14.895 4.032 3.912
2011 14.827 4.044 4.105
2012 14.754 4.068 4.286
2013 14.685 4.100 4.465
2014 14.674 4.012 4.623
2015 14.684 4.030 4.773
2016 14.801 4.009 4.832
2017 15.050 4.102 4.798
2018 15.311 4.088 4.773
2019 15.581 4.108 4.725
2020 15.379 4.120 4.799
TABLE 1
TENURE IN ENGLAND (MILLIONS OF HOMES)
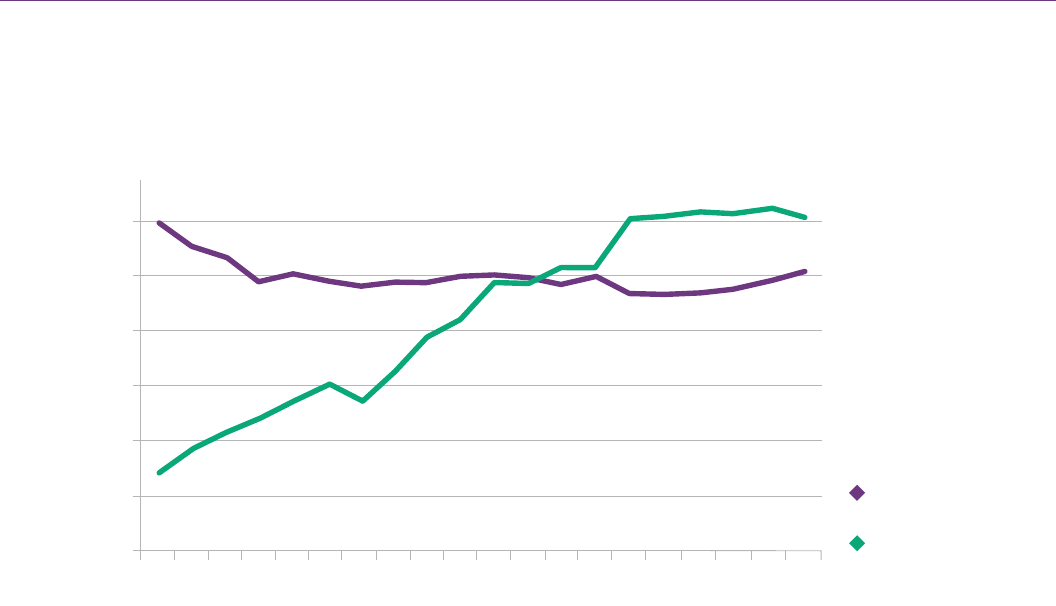
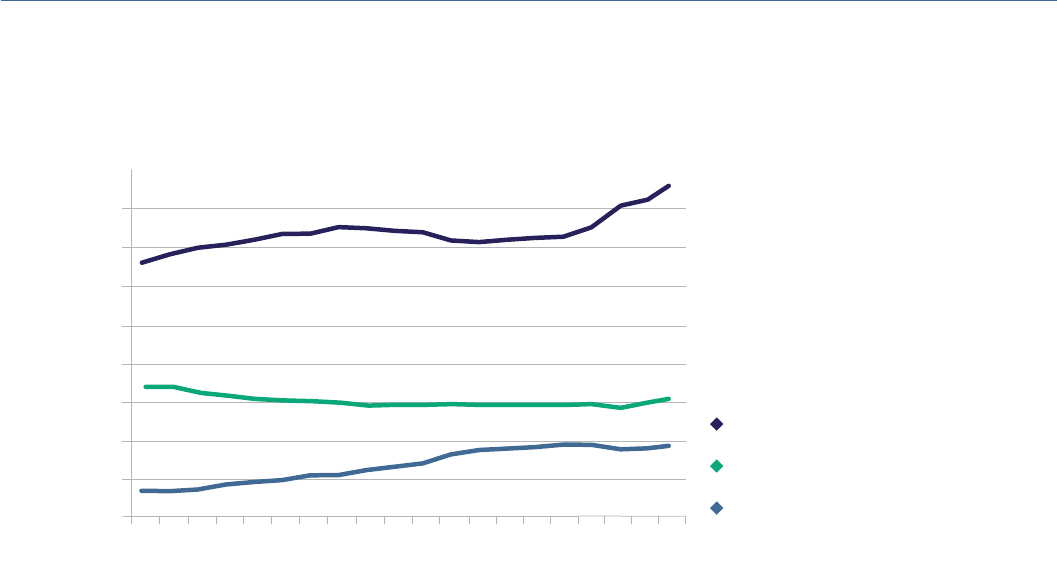
FIGURE 1
PRIVATE RENTING AND SOCIAL RENTING IN ENGLAND
(HOMES IN MILLIONS)
Source: Housing Review JRF/CIH
2016
2
3
4
5
2001
2002
2003
2004
2005
2006
2007
2008
2009
2010
2011
2012
2013
2014
2015
2018
2017
2020
2019
Social renting
Private renting
| TDS England & Wales
5
Year Owner occupation Social renting Private renting
2001 0.941 0.243 0.090
2002 0.957 0.240 0.089
2003 0.966 0.233 0.097
2004 0.980 0.226 0.103
2005 0.990 0.223 0.108
2006 0.998 0.222 0.113
2007 1.002 0.221 0.122
2008 1.001 0.221 0.135
2009 0.989 0.220 0.157
2010 0.983 0.221 0.171
2011 0.980 0.230 0.181
2012 0.977 0.223 0.191
2013 0.983 0.233 0.190
2014 0.981 0.223 0.196
2015 0.974 0.224 0.208
2016 0.986 0.224 0.202
2017 0.990 0.226 0.203
2018 0.994 0.227 0.204
2019 0.996 0.229 0.207
2020 1.003 0.230 0.205
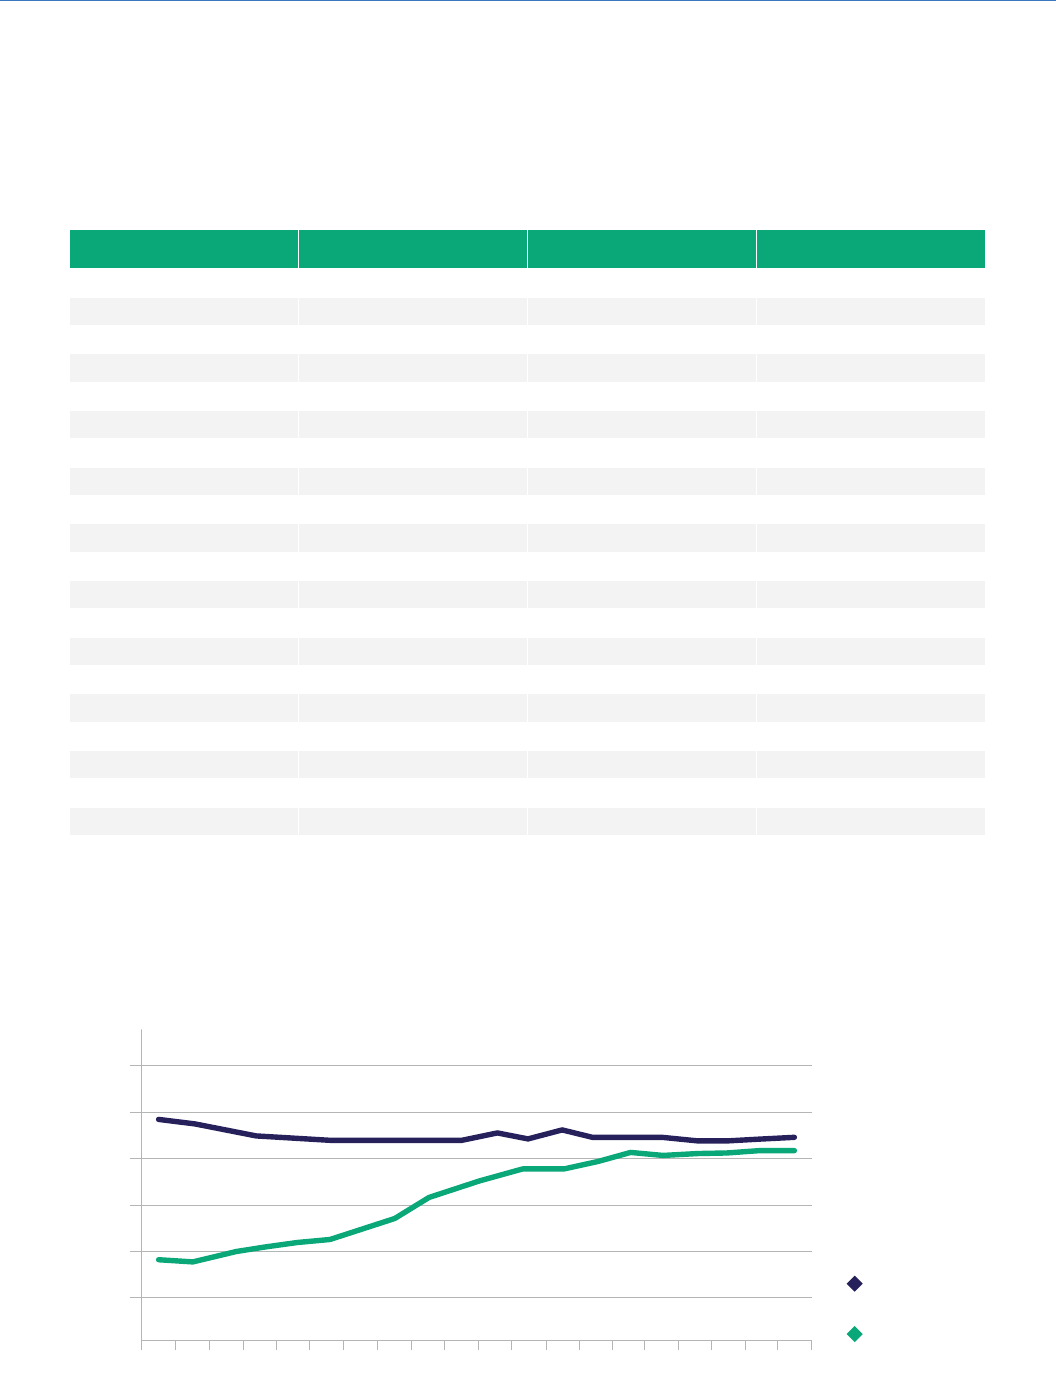
TABLE 2
TENURE IN WALES (MILLIONS OF HOMES)
Source: Housing Review JRF/CIH
FIGURE 2
PRIVATE RENTING AND SOCIAL RENTING IN WALES
(HOMES IN MILLIONS)
Source: Housing Review JRF/CIH
0.000
0.050
0.100
0.150
0.200
0.250
0.300
2001
2002
2003
2004
2005
2006
2007
2008
2009
2010
2011
2012
2013
2014
2015
2017
2016
2019
2018
2020
Social renting
Private renting
| TDS England & Wales
6
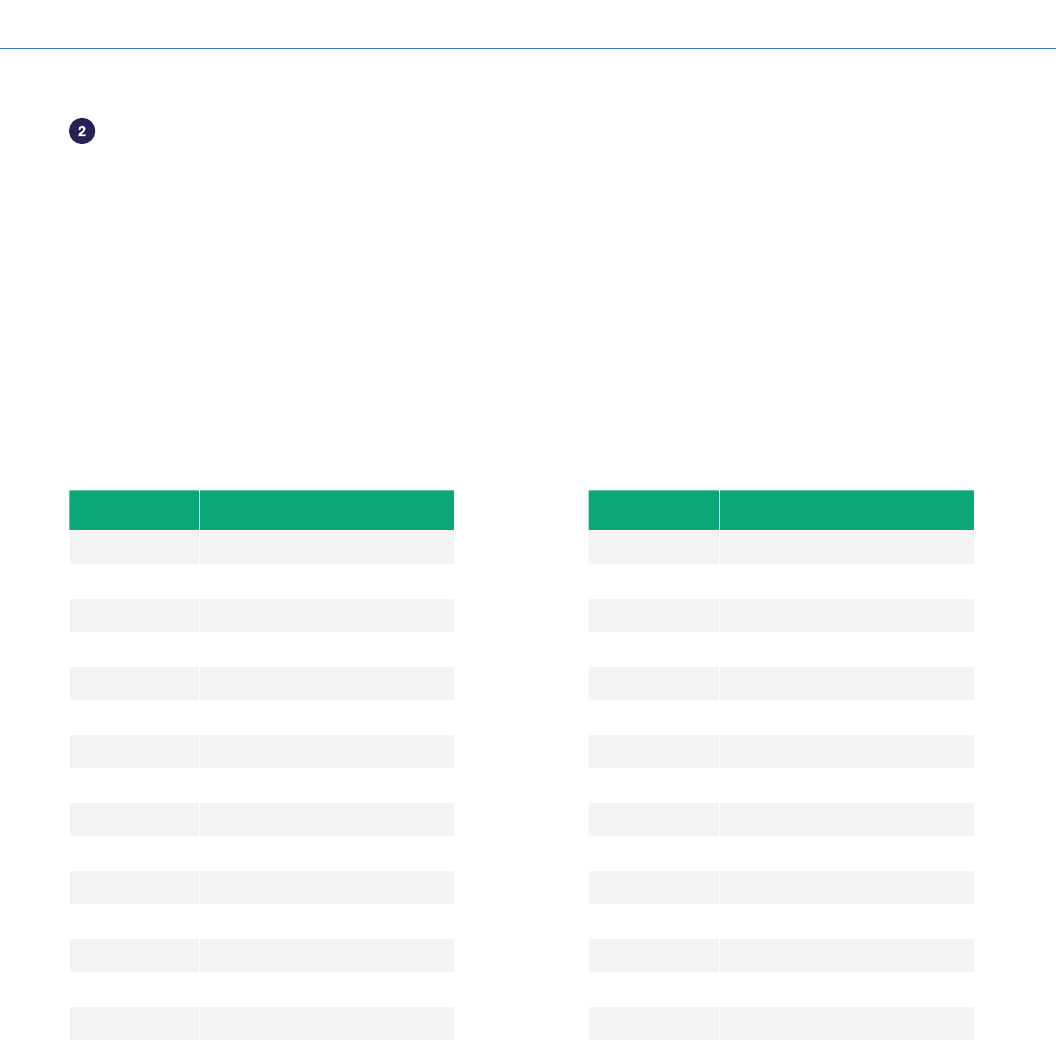
In England and Wales, deposits taken on Assured Shorthold Tenancies (AST’s) must be protected in a
Government approved TDP scheme. Tenancy deposit protection legislation came into force in April 2007 and over
the years there has been a steady increase in the number of tenancy deposits protected, reflecting the increase in
the size of the private rented sector.
The table below (Table 3) illustrates the growth of tenancy deposits protected in England and Wales in both
Insured and Custodial schemes since March 2008.
TENANCY DEPOSITS IN ENGLAND AND WALES
Year Total deposits protected
March 2008 924,181
March 2009 1,553,130
March 2010 1,888,532
March 2011 2,220,543
March 2012 2,374,385
March 2013 2,659,301
March 2014 2,848,110
March 2015 3,066,130
March 2016 3,425,718
March 2017 3,691,242
March 2018 3,840,216
March 2019 3,979,202
March 2020 4,141,467
March 2021 4,242,373
March 2022 4,459,606
TABLE 3
NUMBER OF TENANCY
DEPOSITS PROTECTED IN
ENGLAND AND WALES
Source: FOI Data
Year Value of tenancy deposits
March 2008 £885,098,501
March 2009 £1,406,482,263
March 2010 £1,661,896,693
March 2011 £2,104,219,832
March 2012 £2,325,317,355
March 2013 £2,637,843,361
March 2014 £2,865,824,221
March 2015 £3,187,501,867
March 2016 £3,566,784,769
March 2017 £4,017,045,899
March 2018 £4,159,663,783
March 2019 £4,408,543,068
March 2020 £4,307,902,071
March 2021 £4,348,937,027
March 2022 £4,531,196,470
TABLE 4
TOTAL VALUE OF TENANCY
DEPOSITS PROTECTED IN
ENGLAND AND WALES
Source: FOI Data
| TDS England & Wales
7
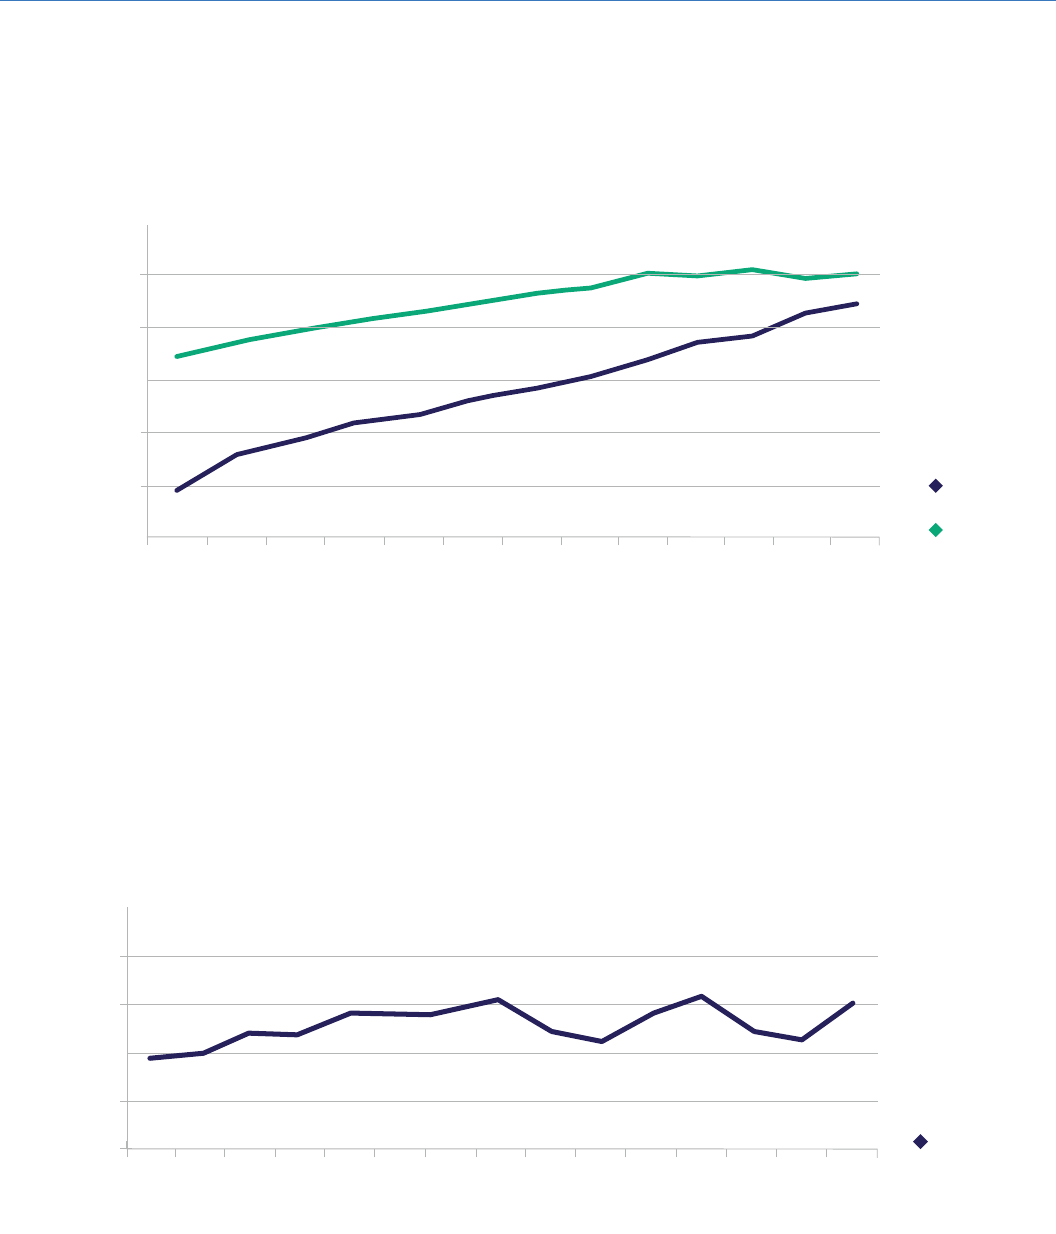
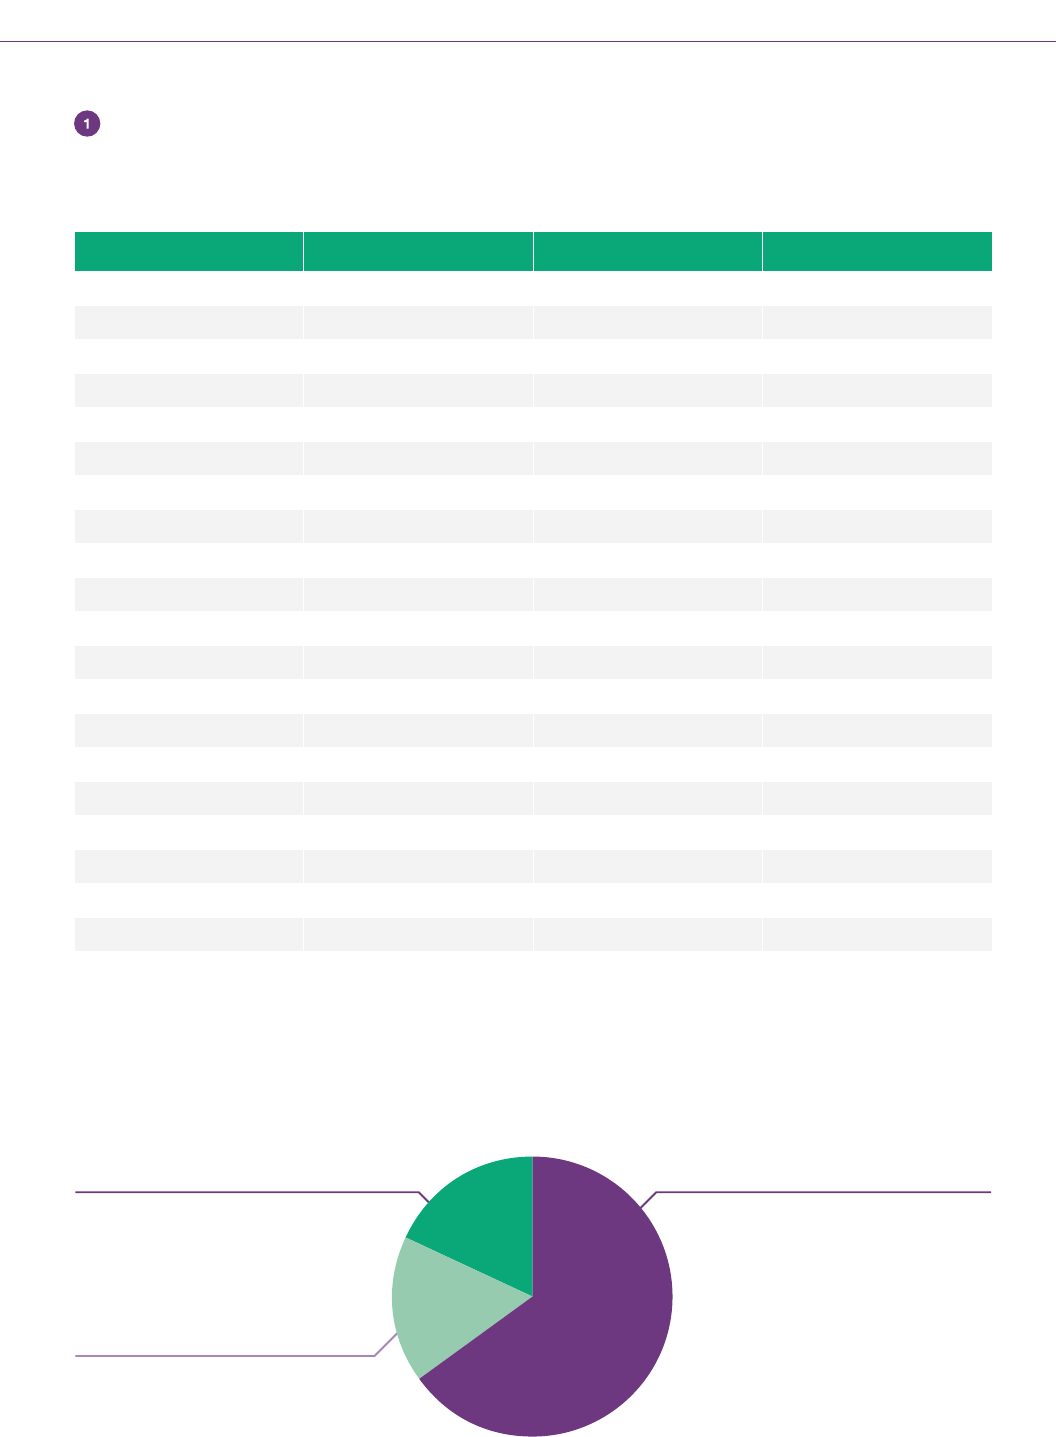
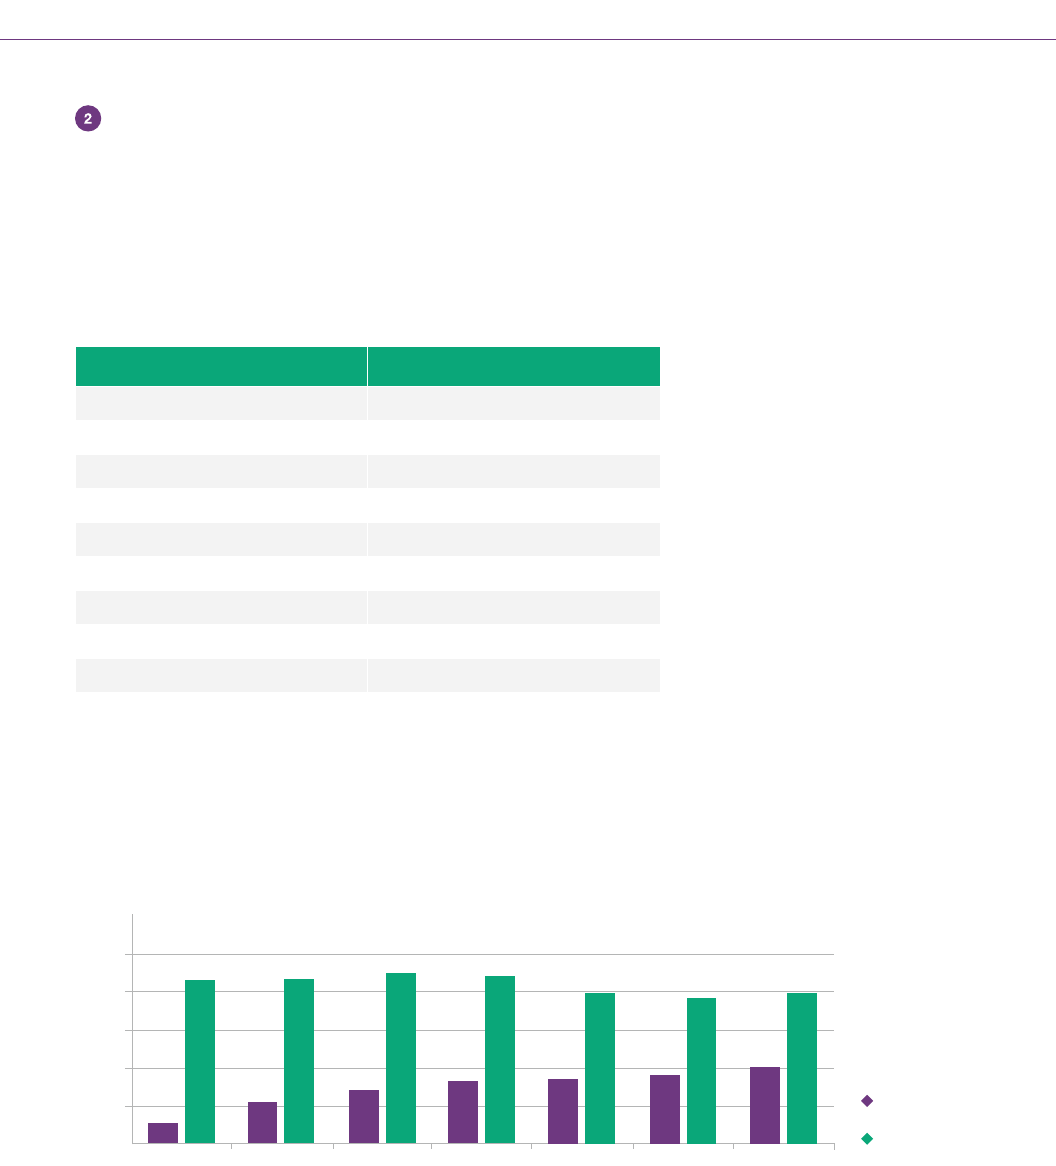
FIGURE 3
TENANCY DEPOSITS PROTECTED COMPARED TO THE NUMBER OF PRIVATE
RENTED SECTOR HOMES IN ENGLAND AND WALES SINCE MARCH 2008
Average value of tenancy deposits protected in England and Wales
Source: FOI Data
It should be noted that these gures do not illustrate the large variations between regions in England and Wales.
The drop in deposit values in 2020 is the result of the deposit cap which was introduced in England in June 2019.
FIGURE 4
AVERAGE VALUE OF TENANCY DEPOSITS PROTECTED IN ENGLAND AND WALES
0
1,000,000
2,000,000
3,000,000
Mar 2008
Mar 2009
Mar 2010
Mar 2011
Mar 2012
Mar 2013
Mar 2014
Mar 2015
Mar 2017
Mar 2016
Mar 2019
Mar 2018
Mar 2020
4,000,000
5,000,000
Deposits protected
PRS homes
£800
£900
£1,000
Mar 2008
Mar 2009
Mar 2010
Mar 2011
Mar 2012
Mar 2013
Mar 2014
Mar 2015
Mar 2016
Mar 2017
Mar 2019
Mar 2018
Mar 2021
Mar 2020
Mar 2022
£1,100
£1,200
Average deposit
| TDS England & Wales
8
Year Dispute percentage Total disputes
March 2008 0.05% 458
March 2009 0.52% 8,098
March 2010 1.08% 20,363
March 2011 0.82% 18,156
March 2012 0.85% 20,279
March 2013 0.92% 24,448
March 2014 0.88% 25,029
March 2015 0.89% 27,816
March 2016 0.82% 28,100
March 2017 0.83% 30,742
March 2018 0.85% 31,865
March 2019 0.89% 35,513
March 2020 0.84% 34,993
March 2021 0.70% 29,697
March 2022 0.70% 31,276
The legislation covering TDP in England and Wales provides for free alternative dispute resolution if the parties are
unable to agree how the tenancy deposit should be divided at the end of the tenancy.
DISPUTES
TABLE 5
ADJUDICATIONS AS A PERCENTAGE OF TENANCY DEPOSITS PROTECTED
IN ENGLAND AND WALES
Source: FOI Data
ADJUDICATIONS AS A PERCENTAGE OF TENANCY DEPOSITS PROTECTED
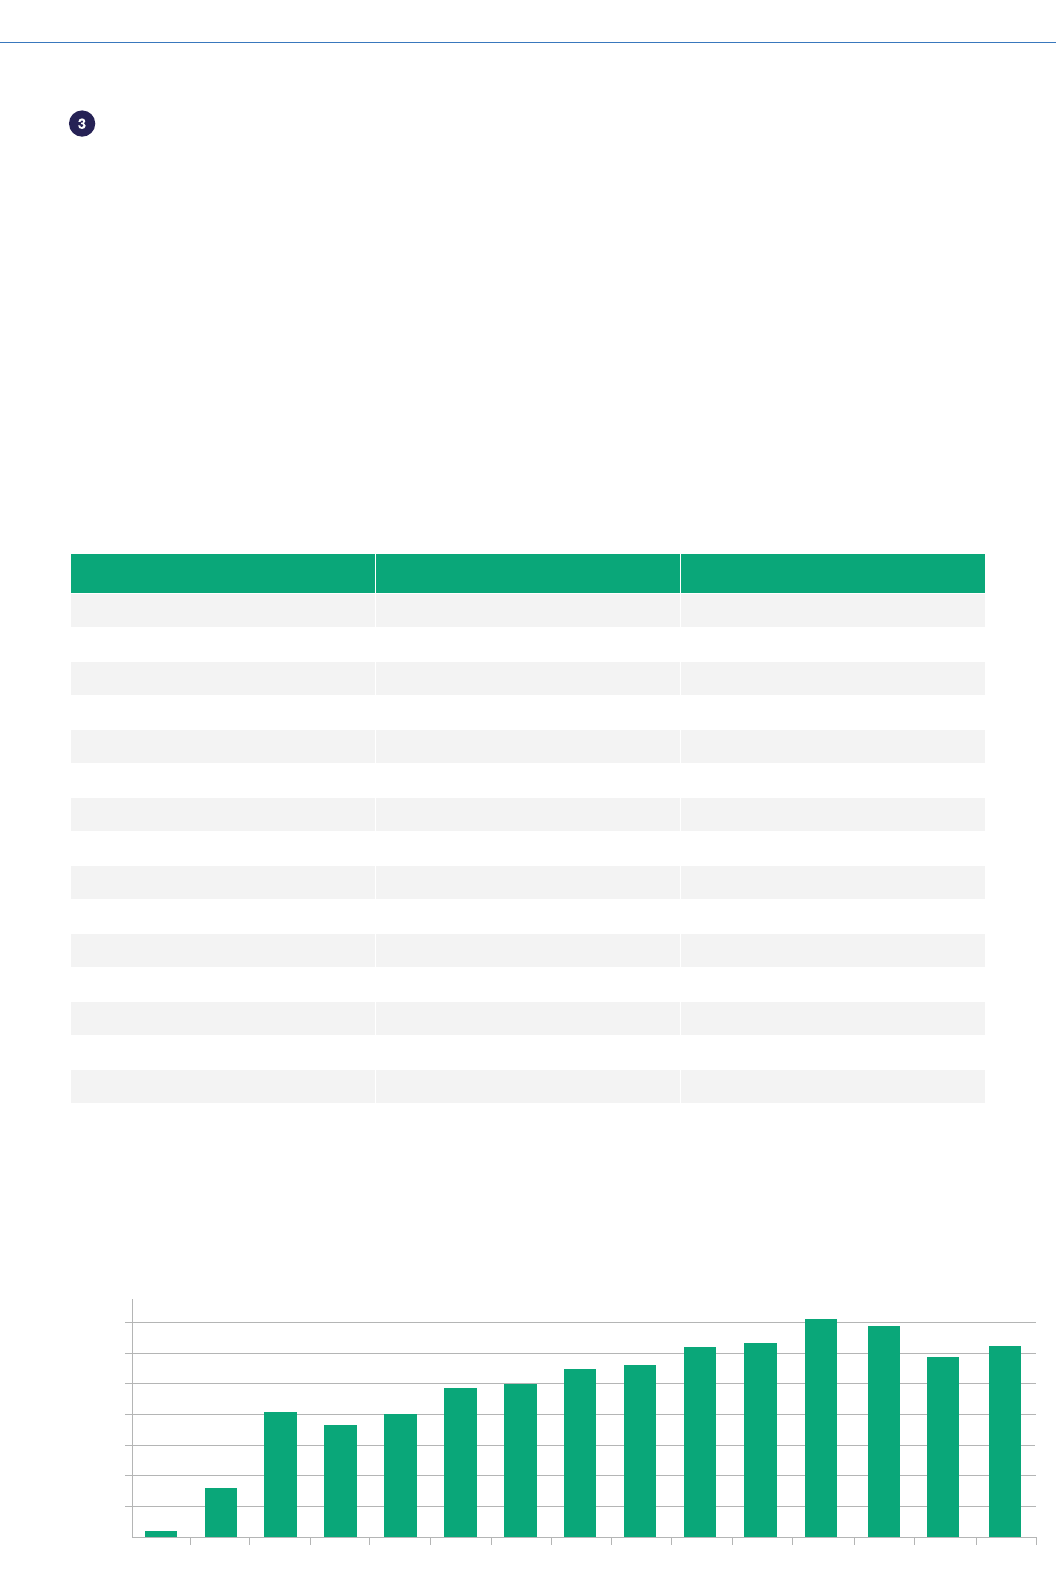
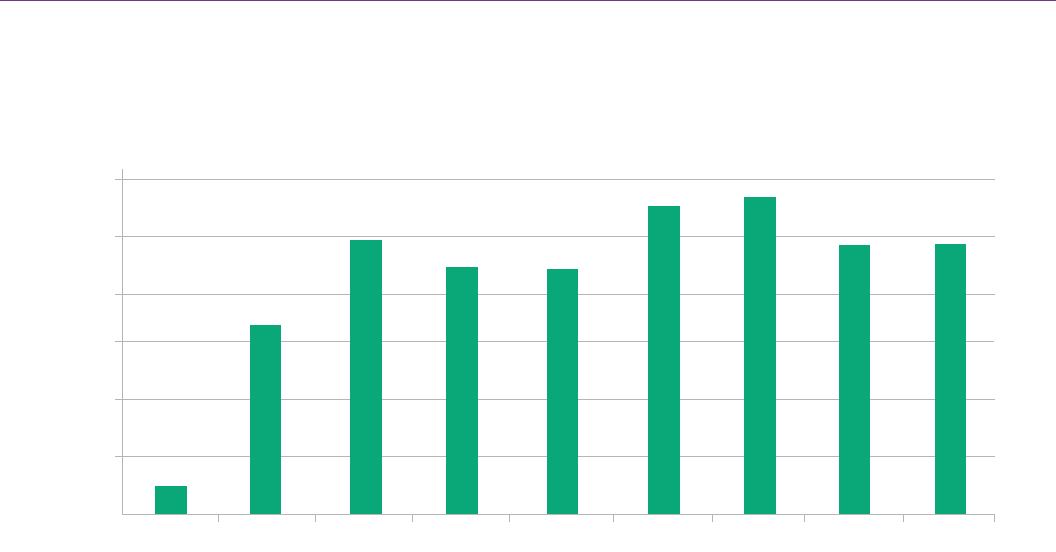
TDP legislation was introduced, in part, in response to concerns that a signicant minority of tenants felt that their
tenancy deposit was unreasonably withheld and had experienced difculty in getting their deposit back.
However, the consistent experience of the schemes is that disputes are raised in a low proportion of cases,
typically fewer than 1% of tenancy deposits protected.
3
Source: FOI Data
FIGURE 5
ADJUDICATIONS COMPLETED BY YEAR, FOR ALL TENANCY DEPOSIT SCHEMES IN
ENGLAND AND WALES
0
5,000
10,000
15,000
30,000
25,000
20,000
35,000
Mar 2008 Mar 2009 Mar 2010 Mar 2011 Mar 2012 Mar 2013 Mar 2014 Mar 2015 Mar 2016 Mar 2017 Mar 2019Mar 2018 Mar 2021Mar 2020 Mar 2022
| TDS England & Wales
9
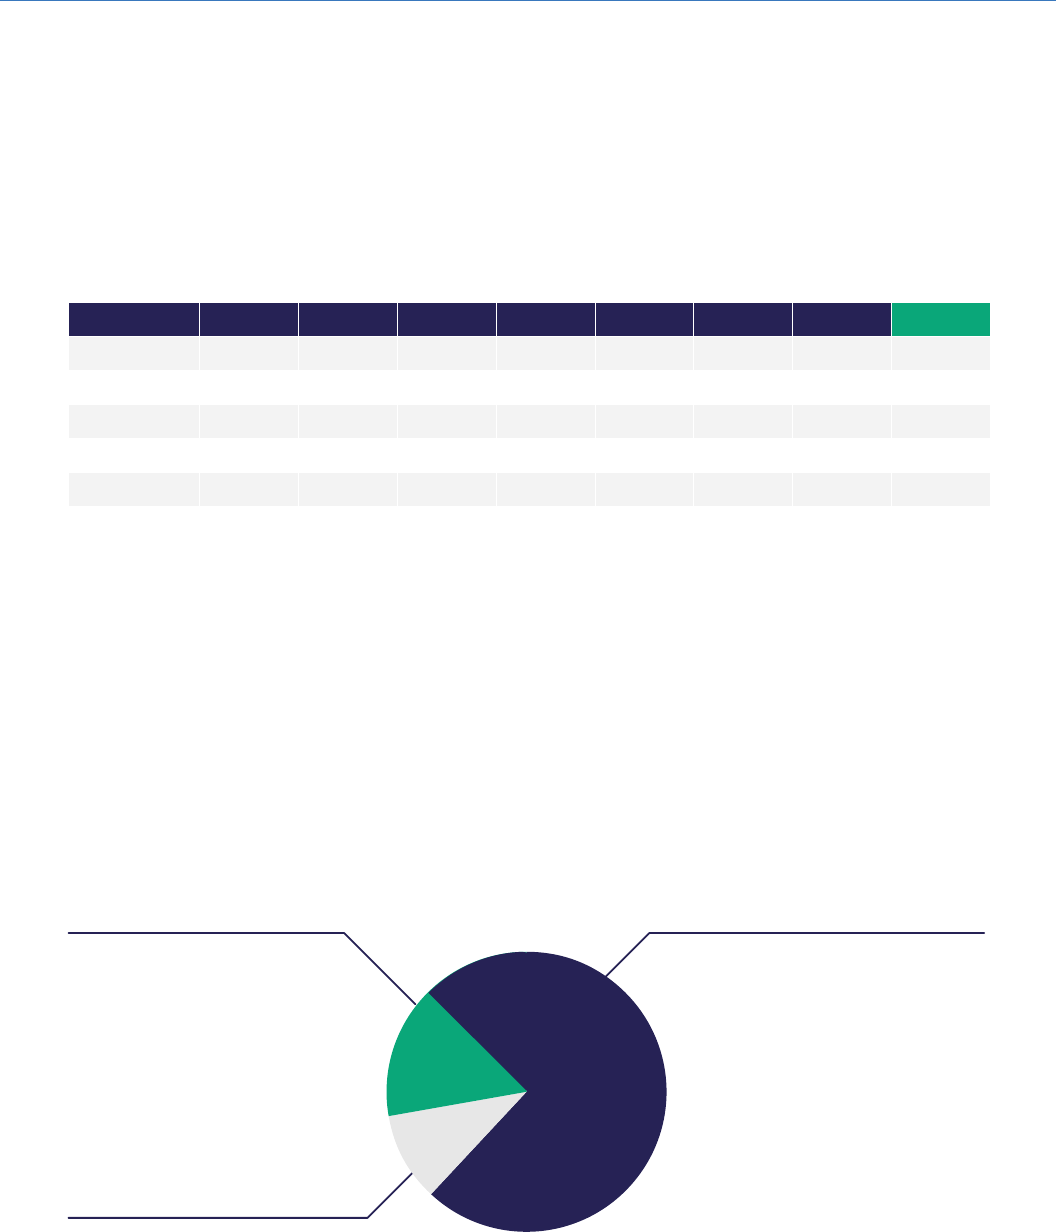
Agent - 18%
REASONS FOR TENANCY DEPOSIT DISPUTES
The table below (Table 7) shows the issues arising in TDS’ dispute cases since 2013. Cleaning remains the most
common area of dispute in the cases we deal with, appearing in over half our cases in each year; damage claims
follow closely behind.
WHO RAISES TENANCY DEPOSIT DISPUTES WITH TDS?
TDS Insured is the only TDP scheme which allows agents, landlords and tenants to raise disputes in the Insured
scheme. Disputes in the Custodial scheme arise because the parties are unable to reach agreement during the
repayment process and are not specically raised by one party.
FIGURE 6
WHO RAISES DISPUTES WITH TDS INSURED?
Source: TDS Insured Disputes Data
TABLE 6
REASONS FOR TENANCY DEPOSIT DISPUTES IN TDS INSURED
Dispute 2014-15 2015-16 2016-17 2017-18 2018-19 2019-20 2020-21 2021-22
Cleaning 58% 57% 56% 54% 53% 42% 49% 50%
Damage 51% 51% 51% 49% 49% 41% 35% 46%
Redecoration 31% 32% 28% 31% 30% 39% 26% 28%
Gardening 17% 16% 16% 16% 15% 23% 12% 13%
Rent arrears 19% 19% 20% 20% 18% 14% 15% 13%
Source: TDS disputes data
*Percentage of cases where claims arise
Tenant - 74%
Landlord - 8%

*Some of the data included is released by the NI Department
for Communities. Other data is the Tenancy Deposit Scheme
Northern Ireland’s own internal performance reporting.
TDS NORTHERN IRELAND
The Tenancy Deposit Scheme Northern Ireland is a
Government approved, not-for-prot company that
provides Insured and Custodial tenancy deposit
protection in the private rented sector.
The tenancy deposit protection legislation was
introduced in April 2013 in Northern Ireland under
the Tenancy Deposit Schemes Regulations (Northern
Ireland) 2012. This follows the introduction of similar
provisions in England and Wales in April 2007 and in
Scotland in July 2012.
| TDS Northern Ireland
11
TENURE IN NORTHERN IRELAND
Source: Housing Review JRF/CIH
Year Owner occupation Social renting Private renting
2001 488 149 37
2002 481 140 47
2003 491 134 54
2004 501 122 61
2005 505 125 68
2006 508 122 76
2007 523 121 69
2008 524 123 83
2009 517 123 97
2010 521 125 106
2011 512 126 121
2012 514 124 121
2013 510 123 130
2014 513 124 130
2015 504 116 151
2016 510 115 152
2017 514 115 154
2018 521 116 153
2019 524 121 154
2020 531 126 151
TABLE 7
TENURE IN NORTHERN IRELAND (THOUSANDS OF HOMES)
FIGURE 7
TENURE IN NORTHERN IRELAND IN 2020 (PERCENTAGE OF HOMES)
Owner occupation - 66%
Private renting - 19%
Social renting - 15%
| TDS Northern Ireland
12
FIGURE 8
PRIVATE RENTING AND SOCIAL RENTING IN NORTHERN IRELAND
(HOMES IN MILLIONS)
Source: Housing Review JRF/CIH
0
25
50
75
100
125
150
2001
2002
2003
2004
2005
2006
2007
2008
2009
2010
2011
2012
2013
2014
2015
2017
2016
2019
2018
2020
Social renting
Private renting
| TDS Northern Ireland
13
TENANCY DEPOSITS IN NORTHERN IRELAND
In Northern Ireland, deposits taken for private tenancies must be protected in a Government approved tenancy
deposit scheme. Tenancy deposit legislation came into force in April 2013 and there has been consistent growth
in the number of tenancy deposits protected since.
TABLE 8
NUMBER OF TENANCY DEPOSITS PROTECTED IN NORTHERN IRELAND
Year Total deposits protected
March 2014 17,544
March 2015 32,722
March 2016 43,211
March 2017 49,102
March 2018 53,510
March 2019 56,786
March 2020 60,613
March 2021 63,905
March 2022 67,197
Source: NI Department for Communities
Source: NI Department for Communities
FIGURE 9
TENANCY DEPOSITS PROTECTED COMPARED TO THE NUMBER OF PRIVATE
RENTED SECTOR HOMES IN NORTHERN IRELAND
0
Mar 2014 Mar 2015 Mar 2016
30,000
60,000
90,000
120,000
150,000
Deposits protected
PRS homes
Mar 2017 Mar 2018 Mar 2019 Mar 2020

| TDS Northern Ireland
14
TABLE 9
TOTAL VALUE OF TENANCY DEPOSITS PROTECTED IN NORTHERN IRELAND
Year Value of tenancy deposits
March 2014 £9,901,267
March 2015 £18,757,501
March 2016 £23,430,569
March 2017 £28,405,824
March 2018 £31,395,767
March 2019 £34,064,162
March 2020 £36,759,231
March 2021 £39,388,442
March 2022 £43,092,615
Source: NI Department for Communities
FIGURE 10
AVERAGE VALUE OF DEPOSITS PROTECTED IN NORTHERN IRELAND
Source: NI Department for Communities
TENANCY DEPOSITS BY VALUE
£540
£550
Mar 2014
Mar 2015 Mar 2016
Mar 2017
Mar 2020 Mar 2022Mar 2018 Mar 2019 Mar 2021
£560
£580
£590
£600
£570
£610
£620
£630
£640
Average deposit

| TDS Northern Ireland
15
Year Dispute percentage
March 2014 0.35%
March 2015 1.02%
March 2016 1.14%
March 2017 0.94%
March 2018 0.86%
March 2019 0.98%
March 2020 0.94%
March 2021 0.76%
March 2022 0.73%
DISPUTES AS A PERCENTAGE OF TENANCY DEPOSITS PROTECTED
As the table below shows (Table 11), the TDP schemes consistently experience a very low proportion of dispute
cases raised. Since 2014, the rate has ranged from 0.35% to 1.14%. This indicates that parties are generally
successful in reaching agreement without the need to raise a dispute with the schemes.
Legislation covering tenancy deposit protection in Northern Ireland provides for free alternative dispute resolution
if the parties are unable to agree how the tenancy deposit should be repaid at the end of the tenancy.
TABLE 10
ADJUDICATIONS AS A PERCENTAGE OF TENANCY DEPOSITS PROTECTED
IN NORTHERN IRELAND
Source: NI Department for Communities
DISPUTES
TABLE 11
ADJUDICATIONS COMPLETED BY YEAR, FOR ALL TENANCY DEPOSIT SCHEMES IN
NORTHERN IRELAND
Source: NI Department for Communities
Year Total disputes
March 2014 62
March 2015 335
March 2016 492
March 2017 461
March 2018 460
March 2019 556
March 2020 568
March 2021 487
March 2022 488
| TDS Northern Ireland
16
Source: NI Department for Communities 2020
FIGURE 11
ADJUDICATIONS COMPLETED BY YEAR, FOR ALL TENANCY DEPOSIT SCHEMES
IN NORTHERN IRELAND
0
100
200
300
500
600
400
Mar 2014
Mar 2015
Mar 2016
Mar 2017
Mar 2019 Mar 2021Mar 2020 Mar 2022
Mar 2018

| TDS Northern Ireland
17
TABLE 12
REASONS FOR TENANCY DEPOSIT DISPUTES IN TDSNI
Dispute 2016-17 2017-18 2018-19 2019-20 2020-21 2021-22
Cleaning 43% 45% 45% 45% 42% 47%
Damage 43% 35% 38% 41% 40% 45%
Redecoration 29% 26% 28% 28% 27% 28%
Gardening 11% 13% 10% 12% 12% 10%
Rent arrears 19% 26% 22% 24% 26% 22%
Allocation of awards TDSNI 2021-22
100% of disputed deposit awarded to Agent/Landlord 34%
100% of disputed deposit awarded to the tenant 28%
Split awards 38%
Source: TDS NI Disputes Data 2014-2018
Source: TDSNI Disputes Data
*Percentage of cases where claims arise
ALLOCATION OF AWARDS TDSNI 2021-22

*Some of the data included is the latest available data
released by the Scottish Government. Other data is
SafeDeposits Scotland’s own internal performance
reporting.
SAFEDEPOSITS SCOTLAND
SafeDeposits Scotland is a Government approved,
not-for-prot company that provides tenancy deposit
protection in Scotland’s private rented sector (PRS).
The tenancy deposit protection regulations were
introduced in Scotland in 2011 and came into force
on 2nd July 2012. There were some transitional
arrangements but all deposits had to be protected with
a Government approved scheme by 15th May 2013.
| SafeDeposits Scotland
19
TENURE IN SCOTLAND
TABLE 13
TENURE IN SCOTLAND (THOUSANDS OF HOMES)
Year Owner occupation Social renting Private renting
2001 1,370 692 181
2002 1,406 674 179
2003 1,434 655 188
2004 1,447 640 213
2005 1,468 626 225
2006 1,493 613 234
2007 1,562 607 259
2008 1,592 599 259
2009 1,590 594 285
2010 1,584 596 303
2011 1,580 595 320
2012 1,545 597 366
2013 1,537 596 389
2014 1,545 594 394
2015 1,552 595 402
2016 1,558 595 414
2017 1,502 594 393
2018 1,619 596 389
2020 1,651 608 389
Source: Housing Review JRF/CIH
| SafeDeposits Scotland
20
FIGURE 13
OWNER OCCUPATION, SOCIAL RENTING AND PRIVATE RENTING IN SCOTLAND
(HOMES IN THOUSANDS)
Source: Housing Review JRF/CIH
0.000
200
400
600
800
1000
1200
1400
1600
2001
2002
2003
2004
2005
2006
2007
2008
2009
2010
2011
2012
2013
2014
2015
2019
2018
2020
2016
2017
Owner occupation
Social renting
Private renting

| SafeDeposits Scotland
21
TENANCY DEPOSITS IN SCOTLAND
Figure 14 illustrates how the number of tenancy deposits protected have increased in line with the growth of the
private rented sector in Scotland.
TABLE 14
NUMBER OF TENANCY DEPOSITS PROTECTED IN SCOTLAND
FIGURE 14
TENANCY DEPOSITS PROTECTED COMPARED TO THE NUMBER OF PRIVATE
RENTED SECTOR HOMES IN SCOTLAND
Year Total deposits protected Value
March 2013 116,839 £77,773,059
March 2014 149,639 £99,988,374
March 2015 171,466 £112,768,955
March 2016 186,070 £124,603,219
March 2017 202,514 £135,192,767
March 2018 211,955 £142,967,951
March 2019 219,629 £150,844,370
March 2020 221,834 £157,558,331
March 2021 220,791 £161,981,025
March 2022 235,117 £176,043,524
Source: Scottish Government statistics
Source: Scottish Government statistics
0
50000
100000
150000
250000
200000
Mar 2014
Mar 2015
Mar 2016
Mar 2019
Mar 2017
Mar 2020
Deposits protected
PRS homes
300000
350000
400000

| SafeDeposits Scotland
22
DISPUTES
Legislation covering tenancy deposit protection in Scotland provides free alternative dispute resolution if the
parties are unable to agree how the tenancy deposit should be divided at the end of the tenancy.
TABLE 15
ADJUDICATIONS AS A PERCENTAGE OF TENANCY DEPOSITS PROTECTED IN SCOTLAND
TABLE 16
ADJUDICATIONS COMPLETED BY YEAR, FOR ALL TENANCY DEPOSIT SCHEMES
IN SCOTLAND
Source: Scottish Government statistics
Source: Scottish Government statistics
Year Total disputes
March 2013 224
March 2014 2,525
March 2015 4,530
March 2016 4,970
March 2017 5,662
March 2018 5,918
March 2019 6,139
March 2020 6,678
March 2021 5,012
March 2022 PENDING DATA
Year Dispute percentage
March 2013 0.19%
March 2014 1.69%
March 2015 2.64%
March 2016 2.67%
March 2017 2.80%
March 2018 2.79%
March 2019 2.80%
March 2020 3.01%
March 2021 2.27%
March 2022 PENDING DATA

| SafeDeposits Scotland
23
TABLE 16
ADJUDICATIONS COMPLETED BY YEAR, FOR ALL TENANCY DEPOSIT SCHEMES
IN SCOTLAND
TABLE 18
AVERAGE TENANCY DEPOSITS
Source: Scottish Government statistics
Year Average value of deposits
March 2013 £665.64
March 2014 £668.20
March 2015 £657.68
March 2016 £669.66
March 2017 £667.57
March 2018 £674.52
March 2019 £686.81
March 2020 £710.25
March 2021 £733.64
March 2022 £748.75
Source: SafeDeposits Scotland statistics
Table 19 shows the types of disputes arising in SafeDeposits Scotland’s dispute cases.
FIGURE 15
ADJUDICATIONS COMPLETED BY YEAR, FOR ALL TENANCY DEPOSIT SCHEMES
IN SCOTLAND
REASONS FOR TENANCY DEPOSIT DISPUTES
Source: Scottish Government statistics
*Percentage of cases where claims arise
Dispute 2018-19 2019-20 2020-21 2021-22
Cleaning 66% 69% 70% 71%
Damage 42% 42% 43% 46%
Redecoration 18% 21% 20% 25%
Gardening 8% 9% 15% 8%
Rent arrears 18% 15% 9% 11%
TABLE 17
PERCENTAGE OF DISPUTES ARISING IN SAFEDEPOSITS SCOTLAND
0
Mar 2013 Mar 2014 Mar 2015 Mar 2016 Mar 2017 Mar 2018
1000
2000
3000
4000
5000
6000
Mar 2019 Mar 2020 Mar 2021

0300 037 1000
www.tenancydepositscheme.com
Dispute Service Statistical Brieng 2021-22, © TDS
